HeteroGenome DataBase Statistics
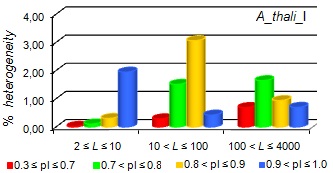
Structural content for reliable heterogeneity (latent periodicity) regions on chromosome I of A. thaliana
Corresponding to revealed period L, for micro- (2 ≤ L ≤ 10), mini- (10 < L ≤ 100) and mega- (100 < L ≤ 4000) satellites, coverage (as a percentage) of the A. thaliana genome by heterogeneity (latent periodicity) regions with various values of preservation level are shown as separate histograms.
The preservation level value in interval 0.3 ≤ pl ≤ 0.7 (red) corresponds to highly diverged tandem repeats; that in interval 0.7 < pl ≤ 0.8 (green) corresponds to moderately diverged tandem repeats; that in 0.8 < pl ≤ 0.9 (yellow) corresponds to slightly diverged tandem repeats and that in 0.9 < pl ≤ 1.0 (blue) corresponds to perfect tandem repeats.
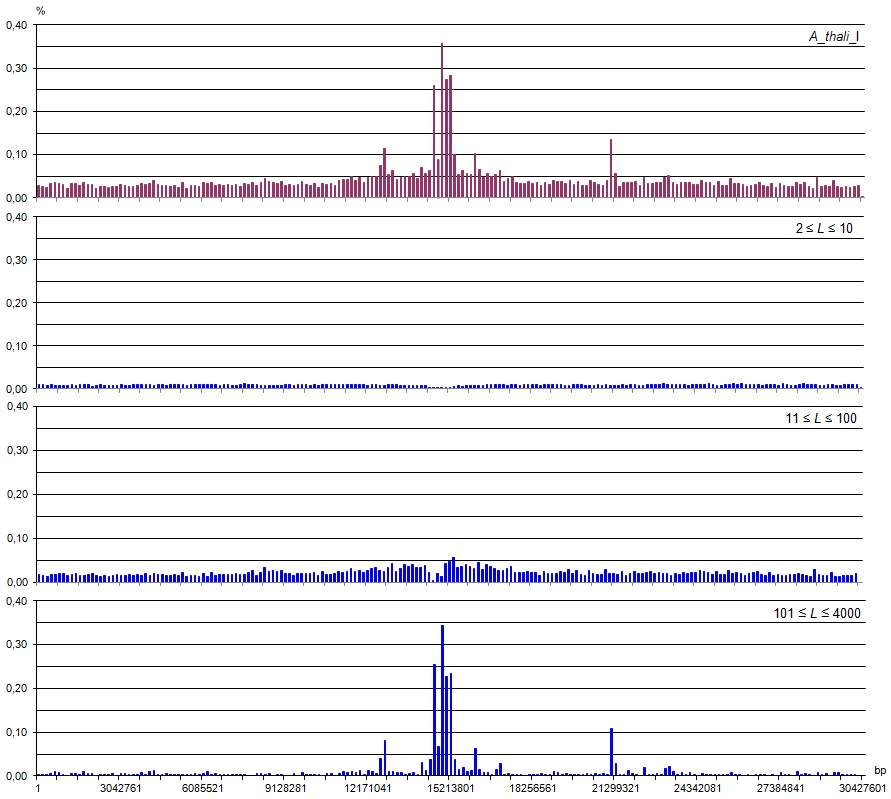
Density distribution of latent periodicity regions over the chromosome
The upper figure shows a histogram of distribution along the chromosome of the coverage formed by all group representatives. The chromosome is divided into 200 intervals (each covers 0.5% of the length of chromosome). The Y-axis shows the share of the interval coverage. The sum of bar heights gives the percentage coverage of whole chromosome. The lower three figures show the distribution of the chromosome coverage by group representatives broken down by classes of repetitions (for micro-(2 ≤ L ≤ 10), mini- (10 < L ≤ 100) and mega-(100 < L ≤ 4000) satellites).